Unlocking the building blocks of AI-Powered Amazon Advertising solutions
Today, we’re excited to announce the release of the Amazon Ads API MCP SDK — the first comprehensive Ads API open-source project that bridges the gap between your favorite AI tools and Amazon’s advertising platform.
Democratizing AI-Powered Advertising
As an Amazon Ads Partner, Openbridge has witnessed firsthand the challenges that businesses face when trying to harness the full potential of Amazon’s advertising ecosystem with AI. While the Amazon Ads API offers incredible capabilities, integrating it with AI systems has traditionally required significant technical expertise and development resources.
That’s why we built the Amazon Ads API MCP SDK — a community-driven, open-source project designed to unlock the value of AI with Amazon Ads API for everyone.
What Makes This Different?
The Amazon Ads API MCP SDK leverages the Model Context Protocol (MCP), which acts as a universal translator between AI models like Claude and external systems.
Comprehensive API Coverage
The SDK doesn’t just cover the basics — it provides access to the full breadth of Amazon’s advertising ecosystem:
Campaign Management — Sponsored Products, Brands, Display, and TV
Amazon Marketing Cloud — Advanced analytics and insights
Reporting & Analytics — Performance data and optimization insights
Creative Management — Asset optimization and testing
Audience Tools — Targeting and segmentation
Getting Started in Minutes
Whether you’re using Claude Desktop, building custom applications, or integrating with existing systems, the MCP SDK provides flexible authentication options and comprehensive documentation to get you up and running quickly.
The Amazon Ads API MCP SDK is just the beginning. We’re building a community of developers, marketers, and innovators who believe in the power of AI to transform advertising.
Get involved:
⭐ Star the project on GitHub to show your support
📚 Explore the documentation and get started with your first integration
🐛 Report issues and suggest improvements
🤝 Contribute code, documentation, or use cases
💬 Join the conversation and share your experiences
Visit our GitHub repository to get started today, and join us in shaping the future of AI-powered advertising.
The Amazon Ads API MCP SDK is developed and maintained by Openbridge, an Amazon Ads Partner. This open-source project is not affiliated with or endorsed by Amazon, but is designed to work seamlessly with Amazon’s advertising platforms.
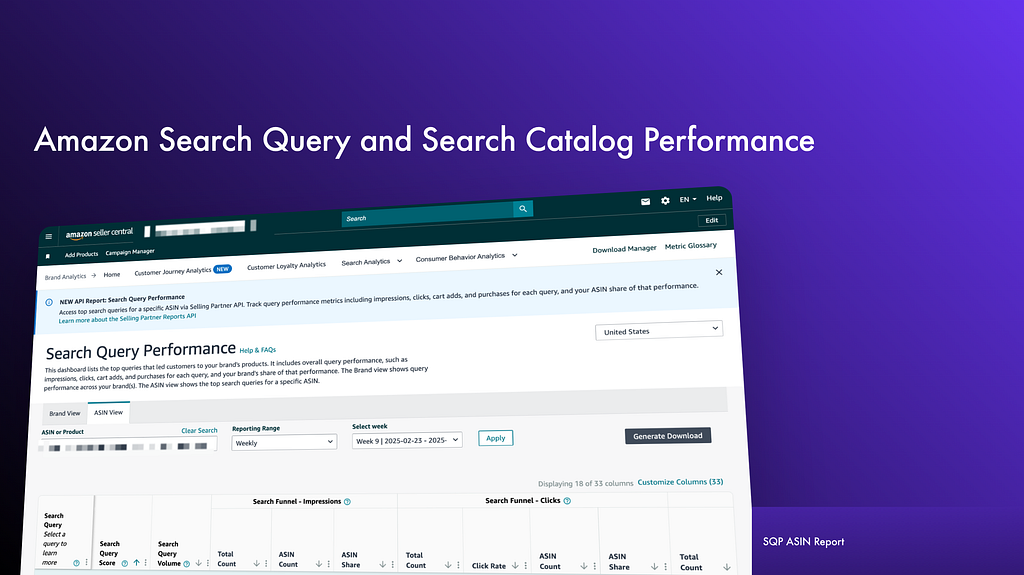
Amazon provides powerful analytics tools to help sellers optimize their product listings and better understand customer behavior.
Two essential tools for sellers are the Search Catalog Performance Data and the Search Query Performance Data. Both datasets offer a roadmap to Amazon’s search algorithm.
By pairing metrics like Brand Share, Purchase Rate, and Shipping Speed with competitor insights, you can Refine PPC campaigns, Optimize listings for high-intent queries, and Anticipate buyer needs (e.g., fast shipping for urgent queries).
Get automated, code free access to Amazon SQP data directly from Openbridge:
Why Your Amazon Sales Funnel Needs the Search Query Performance and Search Catalog Data
If your Amazon sales are stagnating or customers are abandoning their journey, the Search Query Performance (SQP) and Search Catalog Performance (SCP), launched Q1 2025 in the Selling Partner API, are your secret weapons.
These tools decode how shoppers search for and buy products, offering granular insights into:
Search Query Behavior: What terms customers use.
Funnel Drop-Offs: Where they lose interest (clicks, cart adds, purchases).
Competitor Benchmarks: How your ASINs stack up against rivals.
This guide dives into every metric, strategy, and hidden detail to transform raw data into actionable wins.
What Types of Search Query Performance and Search Catalog Performance Data Is Available?
Search Query Volume
Definition: Total searches for a term (e.g., “water bottle” = 100 searches/month).
Use Case: Prioritize high-volume, low-competition terms for PPC campaigns.
Impressions
Total Count: Products displayed for a query (e.g., 1,000 products for “yoga mat”).
Brand/ASIN Count: Your products shown (e.g., 200 impressions for your brand).
Brand/ASIN Share**: Your % of total impressions (e.g., 20% brand share).
Fine Print: Includes below-the-fold and refined search impressions (e.g., “yoga mat + eco-friendly”).
Conversion Rate (Purchase Rate): Efficiency of converting clicks into actual purchases.
Purchase Rate Calculation
Indicates successful customer transitions from clicks to purchases.
Counts only purchases originating directly from search results within 24 hours.
Search Catalog Performance Dashboard: The SQP’s Perfect Partner
While SQP focuses on search terms, the Search Catalog Dashboard zooms into ASIN-level metrics:
Impressions: How often your ASIN appears organically.
Attribution Rules: Only counts actions from search results (excludes widgets/external traffic).
Sales vs. Search Traffic Sales: Compare total sales (all sources) vs. search-driven sales to gauge channel effectiveness.
Search Catalog Performance Metrics
This information focuses specifically on how your products perform within Amazon search results, offering insights about how often and how effectively customers discover, click, add products to carts, and ultimately purchase.
Metrics such as Same Day Shipping Speed, 1D, and 2D Shipping Speeds are incorrect for specific dates (03/31/23 and 04/01/23), affecting minor reporting accuracy for specific periods in 2023 (Weeks 9 & 13, March, April, Q1, and Q2).
Product Title
Represents your product’s title in search results (limited initially to 50 characters).
ASIN ID and Category
Combines the Amazon Standard Identification Number (ASIN) and product category.
ASIN is unique within a marketplace.
Categories help contextualize the product (e.g., “Health and Personal Care”).
Shipping Speeds
Same-Day Shipping: Products purchased, processed, packaged, and delivered within 24 hours. Critical for evaluating how quickly shipping impacts product performance.
1-Day (1D) Shipping: Next-day delivery allows sellers extra time to organize and package orders carefully.
2-Day (2D) Shipping: Two-day delivery speed, crucial for understanding slower but still rapid shipping impacts compared to same-day and 1D.
Median Price
Median price of ASINs at the time of search impressions.
Purchase price may vary due to coupons, shipping, discounts, and more.
Helps evaluate if price influences impressions, clicks, cart adds, and purchases.
Putting SQP and SCP Together: Understanding the Search Funnel
The search funnel illustrates product interactions from initial impression to final purchase.
Impressions
Total views from the search results page, excluding widgets.
Includes organic and sponsored products, refinements, and pages actively viewed by customers.
Clicks & Click Rate (CTR)
Clicks represent detail page views from search results.
Click Rate (CTR) measures engagement by the ratio of clicks to impressions (e.g., 3% CTR if 300 clicks from 10,000 impressions).
No universal “good” CTR — depends on product and device type.
Cart Adds
Counted only when originating from search results.
Indicates customer intent toward purchasing a product.
Purchases
Measures completed sales originating from search within 24 hours.
Excludes sales from widgets or external sources.
Counts purchases regardless of cancellations or returns.
Search Funnel — Purchase Metrics
Includes only transactions initiated and completed within 24 hours from search queries.
Helps sellers understand product conversion and customer intent from clicks to purchases.
Advanced Strategies to Maximize the SQP
Fix Funnel Leaks with Brand Share Analysis
Low Click Share: Weak titles/imagery. Test high-resolution images and keyword-rich titles.
Low Cart Add Share: Poor product descriptions. Use A+ Content to highlight USPs.
Low Purchase Share: Price sensitivity. Run promotions or bundle deals.
Optimize Shipping Speed for Conversions
Queries with high “Same-Day Shipping” clicks indicate urgency (e.g., “last-minute gifts”). Partner with Amazon FBA for faster fulfillment.
Reverse-Engineer Amazon’s Algorithm
Search Query Score: Amazon ranks queries by impressions, clicks, cart adds, and purchases. Target high-score terms with Sponsored Brands ads.
Common Pitfalls & Pro Tips
Data Mismatches: SQP data won’t match Seller Central sales reports due to attribution rules. Use both for holistic insights.
Shipping Speed Metrics: Propagated from impression time (e.g., if a product had 1-day shipping during the click but changed later, the metric still reflects 1-day).
Median Price vs. Purchase Price: Median excludes coupons/taxes, but purchase price includes them — explain price discrepancies to customers proactively.
Getting Started with Amazon Search Query Performance Reports Automation
Ditch the messy, manual reporting for Amazon Search Query Performance Reports. Automated data feeds guide data-driven decision-making to improve off-Amazon digital marketing campaigns.
Openbridge will unify and deliver SQP data to data lakes or warehouses like Redshift, Google BigQuery, Snowflake, Azure Data Lake, and Amazon Athena, giving you a single source of truth. This unified data can turbocharge reporting and analytics tools like Google Data Studio, Tableau, Microsoft Power BI, Looker, Amazon QuickSight, SAP, Alteryx, dbt, Azure Data Factory, and Qlik Sense.
The premise of that post was that AI efforts can thrive on context and domain-specific data. However, one of the challenges to leveraging internal data was the principle mode employees use for interacting with AI occurs via public chat agents.
Sharing Your Intellectual Property Publicly
Let’s start with a simple truth: AI services like ChatGPT, Claude, or Gemini are incredible, but they are public tools built for everyone. That’s their strength — and their limitation.
Your employees, contractors, or partners should never be using these public, general-purpose chatbots to analyze your company’s marketing performance, financial reports, strategy, …but it is likely happening. Sensitive, internal intellectual property (“IP”) is leaking into these public tools, allowing them to train on the information being shared. Not ideal.
Imagine a competitor asking ChatGPT
“What is the marketing and product strategy for Company X, specifically on the launch of Brand Y.”
Now imagine a response from ChatGPT that was trained on the internal data, creative, briefs, strategy docs… that were shared by your employees or partners.
Not good.
What Is An AI Clean Room?
Ok, but the tools are so easy to use. If not those public tools, then what? How about private, trusted AI Clean rooms local to your company or team.
For business, there is a critical need to run specialized, private, and trusted environments, or “walled gardens” for AI. Just as data clean rooms let analysts work with sensitive information without leaking it, AI Clean Rooms isolate proprietary data and models for use in AI.
Sound complicated?
Set Up a Simple AI Clean Room Right Now
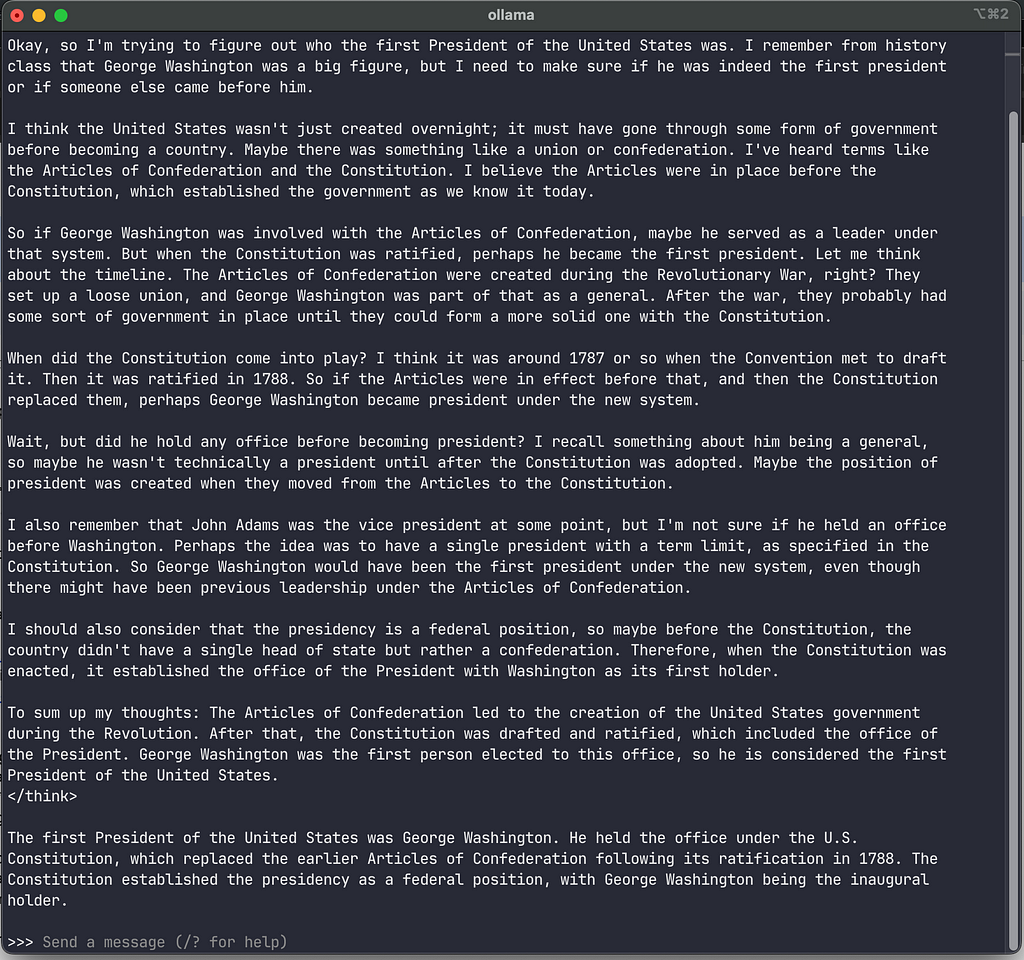
Did you know you can run a private, AI clean room right on your laptop or desktop right now? Any questions or information you shared is private to your laptop or desktop.
Pick (https://ift.tt/2HPQywx or https://huggingface.co/) an LLM that you want to use (appropriate for your laptop or desktop 👍 )
Then run your selected model your model (ie ollama run deepseek-r1:1.5b )
Local Ollama output
Don’t like interacting that way with deepseek? How about using an interface just like Chat GPTs via openweb-ui
Openweb-ui local interface for AI
While this is an overly simplistic view of an AI Clean Room, the crux of the concept applies. Would you prefer employee interactions with AI happen locally or with public ChatGPT?
The Need For AI Clean Rooms Is Real
AI Clean Rooms let organizations harness the best of AI innovation while keeping their “IP” private and their workflows trusted.
Beyond the familiar public chat interfaces, there is an emerging ecosystem of tools, services, and systems that make deploying AI clean rooms a reality today. AI Clean Rooms let organizations harness the best of AI innovation while keeping their data private and their workflows secure. These AI environments aren’t just about security — they’re about trust, value, and flexibility.
AI Clean Rooms was originally published in Openbridge on Medium, where people are continuing the conversation by highlighting and responding to this story.
from Openbridge - Medium https://ift.tt/Su7hPfK
via Openbridge
A deferred transaction refers to a sale where the payment is temporarily held and will be paid out at a future date. Amazon reserves funds from your sales until a specific number of days after your shipments are delivered.
What Are Deferred Transactions?
Deferred transactions are sales proceeds that Amazon holds until certain conditions are met. These conditions typically involve ensuring that the buyer has received the order in the promised condition and that there are sufficient funds to cover potential returns, claims, or chargebacks.
Reasons for Transaction Deferral Transactions may be deferred for the following reasons:
Delivery Date Policy (Orders Awaiting Delivery): Orders placed by customers are typically subject to delivery date-based reserve policies. Sales proceeds are reserved until Amazon confirms that the buyer received the order in the promised condition. This policy ensures that a Seller has sufficient funds to fulfill any returns, claims, or chargebacks.
Invoiced Orders (Orders Pending Buyer Payment): Invoiced orders placed by Amazon Business customers are deferred while awaiting payment by the buyer. These transactions are released after the customer completes their invoice payment, which typically occurs within 30–45 days after the order date. These orders are also subject to delivery date policies, but in most cases, the invoice due date will be later than the reserve period.
Viewing Deferred Transactions
Only released transactions are included for payout in a settlement period. Deferred transactions will not be in yoursettlement reports. Amazon will not return deferred events in theFinance API, which means deferred transactions will will not show up in the API until in they are released.
At the moment, to monitor your deferred transactions:
Navigate to the Transaction View page in Amazon Seller Central.
Select “Deferred transactions” from the “Transaction Status” dropdown menu.
Click “Update” to view the deferral reasons and the expected payment release dates for all deferred transactions.
After the payment release date, the transaction status will update to “Released.”
Understanding Delivery Date Reserves
Delivery date reserves ensure you have enough funds to fulfill financial obligations, such as refunds, claims, or chargebacks.
Duration of Fund Reservation Funds are reserved until a shipment is delivered, plus a reserve period. The standard reserve period is 7 days after the delivery date (“DD + 7” reserve policy). For example, if you sell an item on January 1, and it is delivered on January 6, then under the DD + 7 policy, your funds will become available for disbursement starting on January 14. Your reserve period may be extended following an assessment of your overall risk and historical performance.
Amount of Funds Held Back Delivery date reserves are calculated based on shipment delivery dates. You can view the list of transactions and the corresponding amounts subjected to reserve on the Payments Transaction view, and their total is included as part of the deferred transactions line of the Total Balance tile on the Payments Dashboard.
Impact of Delivery Date Reserves If you recently had a delivery date reserve policy applied to your account, or if you have just started selling, it is normal for all of your funds to be held in reserve.
This is because your reserve amount is based on the funds from shipments that were delivered within your reserve period (with the standard being seven days, or “DD+7”).
When you ship a product, you can view the corresponding payment transaction on Payments > Transaction view. Filter for Transaction status Deferred transactions and click Update to see a list of all transactions currently held in reserve, and the expected payment release date for each transaction.
Funds from these transactions will be released in accordance with the shipment’s delivery date, at which point, the transaction status will update to “released” and funds will be available for transfer to your bank account.
You can also download a detailed report of these transactions by navigating to the Payments Reports Repository and requesting the Report type “Deferred transactions.”
Determining Shipment Delivery Dates When you use an integrated shipping carrier, Amazon will use the actual delivery date of the order. In the absence of valid tracking data, Amazon will use the latest estimated delivery date (EDD).
Strategies to Accelerate Payment Release To expedite the release of your funds:
Prompt Dispatch: Ship your items as soon as possible and confirm dispatch in Manage Orders.
Provide Valid Tracking Numbers: Use integrated carriers and provide valid tracking numbers when confirming shipments. This gives buyers peace of mind, knowing that their package is on the way.
Choose Faster Delivery: Opt for faster delivery methods to reduce the time between shipment and delivery.
By understanding and effectively managing deferred transactions, you can better plan your finances and maintain a healthy cash flow as an Amazon seller.
Customers often head to Amazon in search of items that fit their needs, while also hoping to discover new products and brands. Brand Stores, a free self-service tool, offer brands the chance not only to feature their merchandise but also to communicate their brand’s unique benefits, build a distinctive shopping journey, and potentially increase purchases as well as foster customer loyalty.
According to Amazon data, new-to-brand shoppers who visit a Brand Store are 62.7% more likely to make a purchase compared to those who don’t. Moreover, these shoppers spend 72.3% more on average when they buy after visiting a Brand Store versus those who don’t. In this guide, you’ll learn what Brand Stores are, how to create one for your brand, and how to maximize its advantages.
What Are Brand Stores?
Think of a Brand Store as your brand’s digital storefront on Amazon. It offers a multi-page, immersive shopping environment that increases the likelihood of customers getting to know — and growing to love — your brand. In turn, this familiarity can lead them to purchase your products.
A Brand Store allows you to:
Showcase your full product lineup.
Feature specific collections, seasonal offers, and discounts.
Present storytelling content about your brand’s background.
Best of all, creating a Brand Store is completely free.
How To Create Brand Store In Amazon
There is no cost to create a store, and no design background is required.
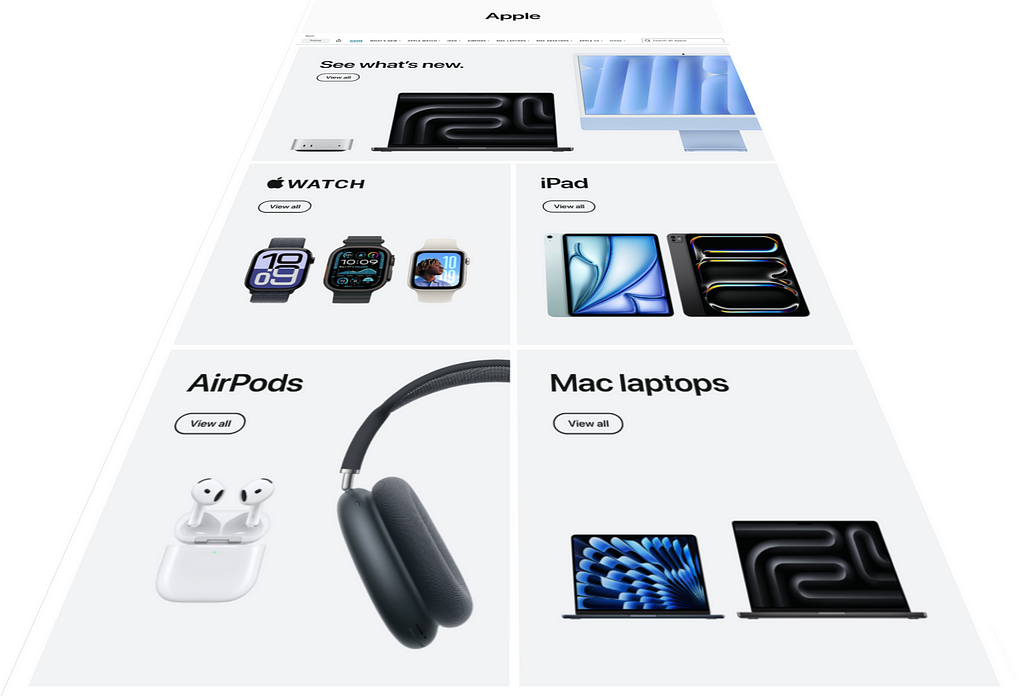
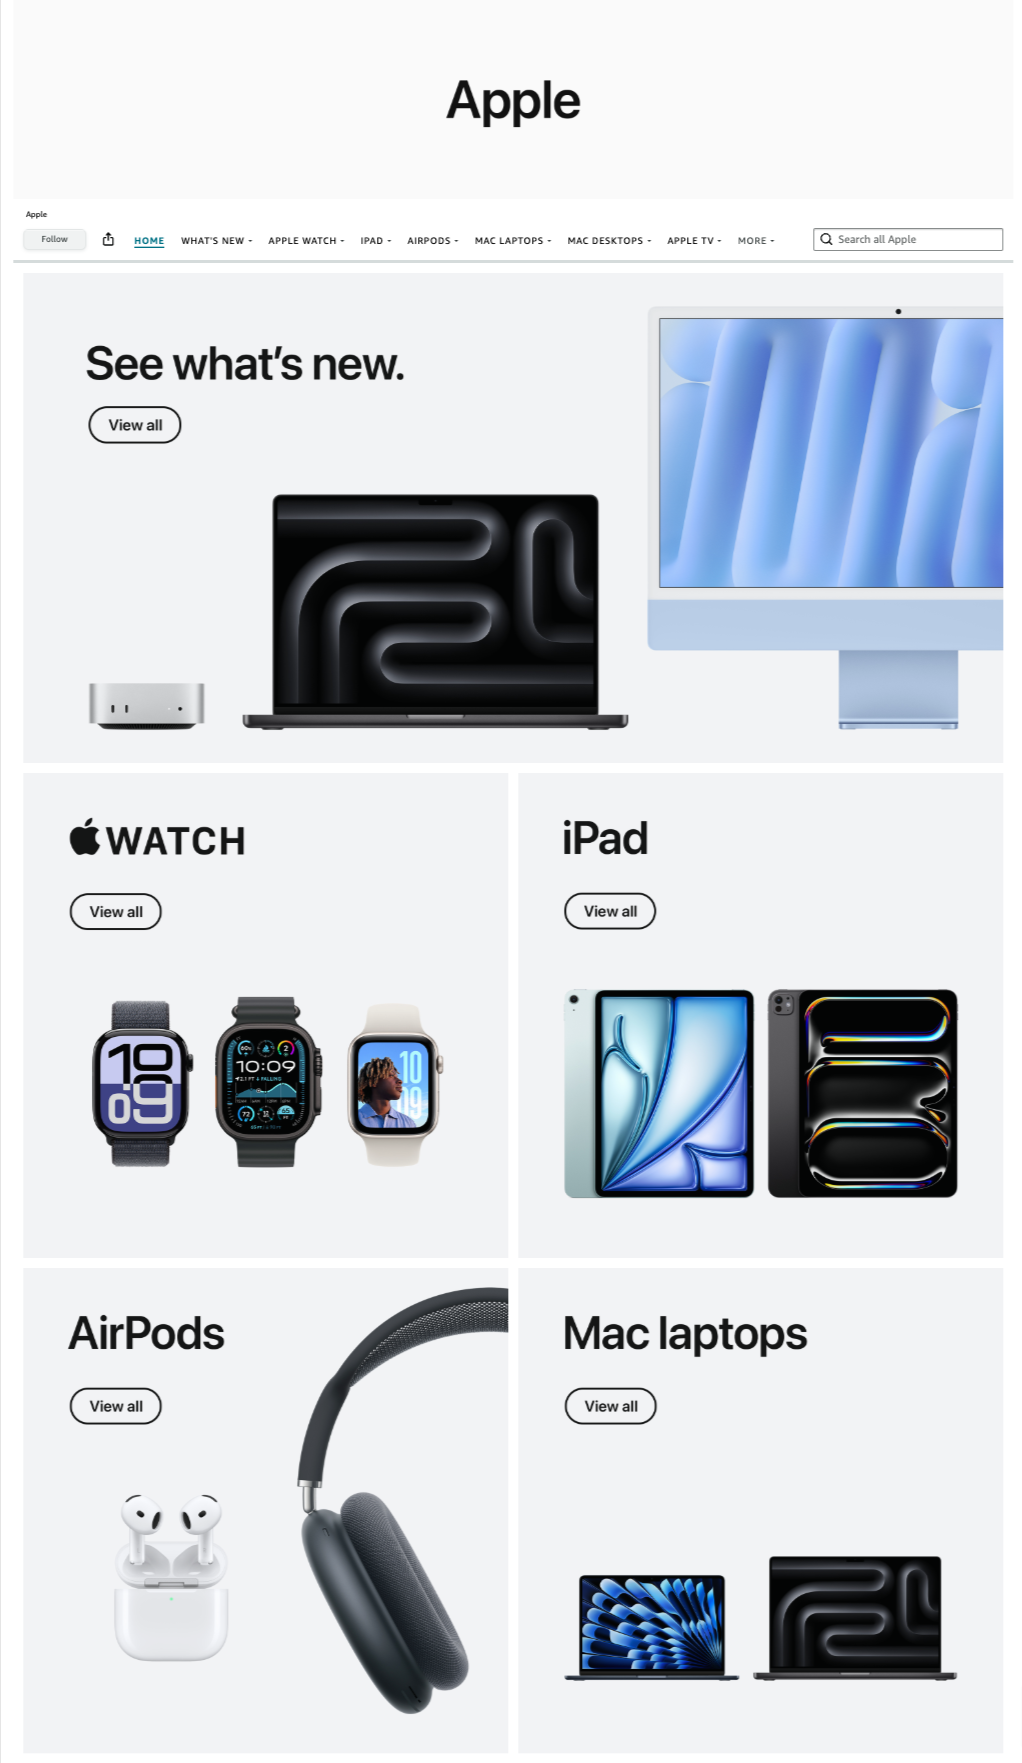
Below is an example of the Apple Brand store design. It excels in delivering a clean, minimalist aesthetic that aligns perfectly with Apple’s premium branding. The clear product categorization, high-quality images, and intuitive navigation create a seamless shopping experience that feels refined and sophisticated.
Apple Amazon Brand Store Example
Clean and Minimalist Design — The store features a sleek, modern aesthetic with ample white space, making it visually appealing and easy to navigate.
Clear Product Categorization — The layout effectively separates product categories (Mac laptops, iPads, Apple Watch, AirPods), making it easy for users to find what they’re looking for.
High-Quality Product Images — The store uses crisp, high-resolution images that showcase the products effectively, improving engagement and conversion rates.
Easy Navigation — The top navigation bar includes a clear structure with product categories, a search bar, and a “View All” button under each category, which aligns with Amazon’s best practices for user-friendly navigation.
Strong Branding — The store maintains Apple’s consistent branding with its iconic typography, imagery, and design language, enhancing trust and brand recognition.
While traditional e-commerce best practices often emphasize promotions, reviews, and aggressive CTAs, Apple’s approach prioritizes elegance, simplicity, and brand trust over clutter.
The absence of discounts or social proof may seem like a drawback in a typical online store, but for a brand like Apple, it reinforces exclusivity and confidence in its products.
Instead of overwhelming customers with urgency-driven tactics, the design encourages exploration and discovery through subtle yet effective navigation cues. This balance ensures the store remains both aesthetically appealing and functionally effective, reflecting Apple’s philosophy of merging technology with effortless user experiences.
Amazon Brand Store Templates
You can use pre-made templates and a drag-and-drop interface to develop a store that suits your brand identity and highlights your best-selling products.
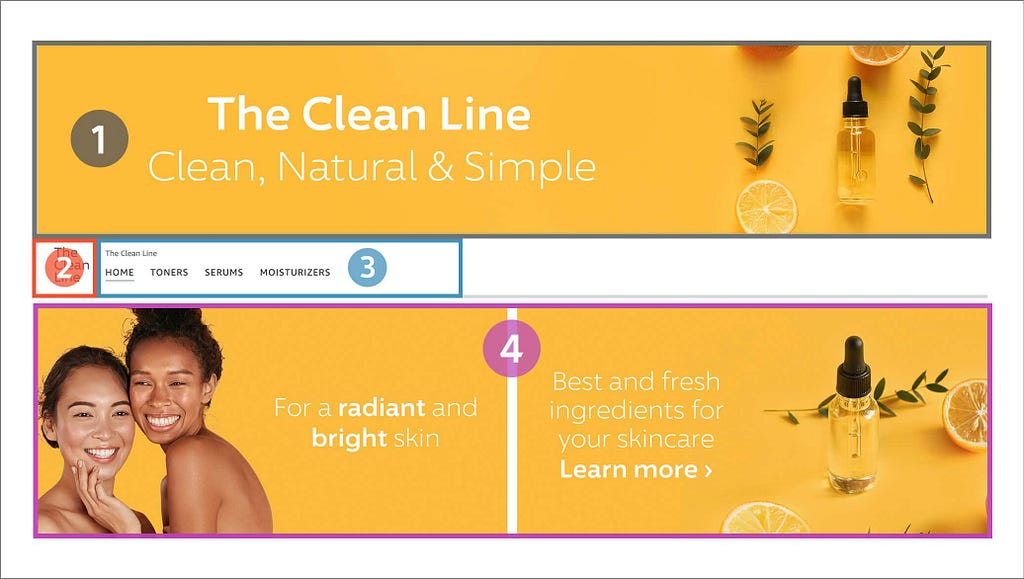
One design best practices is the “above the fold” section of a Store — what it is, why it matters, and how to leverage it effectively. Traditionally, “above the fold” refers to the top section of a newspaper or newsletter, visible without unfolding the page. In a digital context, particularly for Amazon Stores, it represents the content immediately visible when a shopper lands on the page — before scrolling.
Source: Amazon
This prime real estate is crucial for capturing attention, establishing brand identity, and making a strong first impression. Since shoppers tend to focus on this area, optimizing it can significantly impact engagement and conversions.
Once you’ve built your Brand Store, the next step is attracting visitors. Customers can find your store by clicking on your brand byline on Amazon product detail pages or by visiting the short URL for your store. The “store byline” is the link near the top of a product detail page.
You can also use your store as a landing page for Amazon or non-Amazon marketing efforts, helping boost brand awareness and cross-selling opportunities.
Below are five strategies to help generate traffic and engagement:
Sponsored Brands
One of Amazon’s self-service advertising tools is Sponsored Brands. When configuring a Sponsored Brands campaign, you decide whether to direct customers to a custom landing page featuring a product collection or to your Brand Store. Data shows advertisers who linked their Sponsored Brands campaigns to a Store saw shoppers spend twice as long on their Store. Additionally, there was a 55% increase in product detail page views and a 15% increase in sales.
Byline
The byline appears near the product title in blue text on product detail pages. This link can drive organic traffic to your Brand Store. Shoppers curious about your brand can click on the byline and land directly on your Store.
Posts Posts on Amazon can also help drive visitors to your Brand Store. When customers see your post and feel inspired, they can click through to reach your Store directly. This creates a smooth transition from your content to exploring more about your brand, products, and story.
External Traffic
You can also encourage audiences on external platforms — such as social media, email marketing, or your own website — to visit your Brand Store by sharing a trackable link. In your Store’s insights dashboard, you can create a source tag for each link, then track the traffic and engagement from these external sources.
Search Engine Optimization (SEO)
You can leverage SEO in a few ways to drive traffic:
Google Sitemap: Brand Store pages’ URLs are included in Google’s Sitemap, which notifies search engines about your pages to crawl and index.
Canonical URLs: For Brand Stores that share the same name as the brand byline, a canonical URL is generated containing both the Store and page name. This helps search bots recognize the relationship between the Brand Store and relevant keywords.
Deep-linking on iOS: Brand Store links posted on third-party sites automatically open the Amazon Shopping app on iOS if it’s installed, leading shoppers directly to your Store page.
Stores Insights
The Stores insights feature provides data on your Store’s performance, including traffic metrics and sales figures broken down by both traffic source and Store page.
Once your Brand Store is live, you can monitor its progress using the insights dashboard. Here’s how to access it:
In the left navigation menu of your Amazon Ads console, click the Brand home icon.
Select Stores.
Locate your Store and click See Insights.
If you’re using the Store builder, switch to the Insights tab within the builder. You can view metrics for the entire Store or for specific pages currently being viewed.
The insights dashboard highlights daily visitors, page views, and sales attributed to your Store. You can export some of this data as a CSV file, but there are no dedicated Stores insights reports beyond what’s in the dashboard. Data appears as follows:
Page views and visits: Available the next day.
Attributed units and sales: Available after two days.
For example, on a Wednesday, you can see views and daily visits up to Tuesday and attributed units and sales up to Monday.
Navigating the Stores Insights Dashboard
A sidebar lets you switch between the different reports: Overview, Traffic, Engagement, Sales, Pages, and Sources. Each view displays your data in graph form.
You can adjust the date range to get insights over various windows of time and compare performance across different periods.
The Overview tab provides a big-picture summary of your Store’s performance. You can see multiple dimensions at once, then dive deeper into each individual metric through the other tabs.
Traffic
The Traffic section has four key dashboards:
Daily Visitors: Displays the number of visitors per day. Use this to assess whether your Store promotions or advertising tactics are attracting consistent traffic.
Page Views: Shows how many page views you receive each day, including repeat views by the same audience. You can gauge whether customers are browsing multiple pages and how often they’re returning.
Top Sources by Views: Shows where visitors are coming from, helping you identify which channels are most effective in driving Store traffic. This can inform adjustments to your marketing strategy.
Top Pages by Views: Lists the most frequently viewed pages in your Store. These insights help you learn which product categories or collections are generating the most interest.
Engagement
The Engagement tab focuses on how customers interact with ASINs within your Brand Store. Insights on ASIN clicks, click-through rates, and purchases can help you improve your Store layout and increase overall engagement.
Benefits of using the Engagement tab:
Identify high-performing and most-viewed ASINs to optimize the Store layout and increase click-through and purchase rates.
Gain visibility into products with the best engagement (view-based CTR) and sales (click-based CVR), guiding decisions on which ASINs to feature more prominently.
Spot consumer trends around pricing, inventory, and product planning.
Data available in this tab includes:
Product Engagement Totals: Summaries of ASIN views, clicks, and overall click-through rates.
Top-Clicked Product: Identifies the most-clicked ASIN and displays its views, clicks, CTR, purchases, conversion ratio, and average sale price.
Product Engagement: Detailed metrics for each ASIN, including renders, views, in-stock views, in-stock view rate, average in-stock price, clicks, CTR, add-to-cart, purchases, units sold, conversion ratio, and average sales price.
You can scroll horizontally to see all columns, or use the search box to filter for specific ASINs. For more details, visit the Stores metrics section.
Sales
The Sales tab has four primary dashboards:
Sales: Shows total sales over the chosen time frame, with a dotted line indicating the average daily sales. Use this to see whether your Store and marketing efforts are boosting revenue.
Units Sold: Reveals how many individual products you’ve sold (in units). A dotted line indicates your average daily unit sales for the period.
Top Sources by Sales: Breaks down how customers found your Store before making a purchase. This helps you pinpoint which traffic sources are most profitable.
Top Pages by Units: Shows which pages lead to the most units sold. By examining this data, you can see which pages are most effective at prompting deeper exploration of your products.
Stores Metrics
The Stores insights dashboard offers detailed information on traffic and sales so you can evaluate your Store’s performance.
Here are the key metrics included:
Add to cart: Number of times customers clicked the “Add to cart” button in your Store.
Avg. sales price: Average price of units sold on Amazon within 14 days of the shopper’s last visit to your Store. Includes products listed on your Store or elsewhere under your brand.
Clicks: Number of times a shopper clicked a product in your Store.
Click-through rate (CTR): Percentage of viewers who click a product, calculated as clicks divided by views.
Conversion ratio: Percentage of units sold (attributed to your Store) divided by clicks. Attributed sales are products purchased within 14 days of a visitor’s Store visit.
In stock views: Views where more than 50% of the product tile was visible for over 1 second while the product’s availability status was “in stock.”
In stock view avg. price: Average product price when the product was viewed in-stock.
In stock view rate: Percentage of product views in your Store that occur while the product is in stock.
Orders: Estimated total orders placed by Store visitors within 14 days of their visit. Each order can contain one or multiple units sold.
Purchases: Number of orders in which a specific product was purchased, attributed to your Store. One order can include multiple products.
Renders: Number of times the product fully loaded within your Store’s interface.
Sales: Estimated total sales generated by Store visitors within 14 days of their visit.
Sales/Order: Average sales per order.
Sales/Visit: Average sales per visit.
Sales/Visitor: Average sales per visitor.
Units sold:Number of individual units sold (across any products under your brand) within 14 days of their last Store visit.
Units/Order:Average units purchased per order.
Views:Number of times more than 50% of a product tile was viewed for more than 1 second.
Views/Visitor: Average page views per visitor.
Views/Visit: Average page views per visit.
Visitors: Total unique visitors to your Store during the selected period. A single visitor may view multiple pages or arrive through multiple sources.
Visits:Total visits to a page or from a traffic source on a single day. One visitor can make multiple visits, and can also arrive via different sources.
Dimensions
Date: Calendar date of the visit.
Page: Which Store page was viewed. Data for deleted pages is aggregated under “deleted page.”
Traffic source: The channel that led the visitor to your Store.
Traffic Source Types
Sponsored Brands: Traffic from Sponsored Brands ads.
Amazon organic traffic: Traffic from the brand byline link on product detail pages.
Your tags: Traffic that came from a custom source tag you created.
Other sources: All other traffic, for instance, URL shares on various social media platforms.
Watch For Out-of-Stock Products in Stores
When featured products in your Store go out of stock, these best practices can help maintain a positive customer experience:
If you have fewer than 16 ASINs in a product grid, avoid using “Hide out of stock”. Instead, keep products visible, so customers don’t encounter empty product grids.
If you have more than 16 ASINs and anticipate some going out of stock, you can use Hide out of stock to show only in-stock items.
If a large portion or an entire product grid is out of stock, consider updating your grid to highlight only the most vital ASINs. Alternatively, feature a top product using a full-width product tile without using “Hide out of stock.” You can re-expand the collection once the items return to stock.
If your page only displays a product grid, incorporate other elements (like video) to keep shoppers engaged when items are out of stock.
Short URL for Stores
Once your Store is published, a long URL is automatically created. You can replace it with a short URL for easier recall. Note that this short URL only links to the homepage of your Store.
Tip:Plan URL edits or deletions wellin advance of major sales or holiday eventsto avoid disruptions.
Best Practices for Creating a Short URL
DoDon’t Ensure the short URL includes your brand name or something closely related to your Amazon Ads account. For example, amazon.com/[brandname] Use generic category names, such as amazon.com/toys, or Amazon-owned trademarks (e.g., Fire, Kindle, Alexa, Echo). Characters like “-” or “_” can replace spaces if needed, for example: amazon.com/brand_name Start or end your short URL with “-” or “_” or use special characters like @, $, #, *, /. City names are allowed if they’re part of your brand name, e.g., amazon.com/BostonLager Use a city name that conflicts with an Amazon internal product or trademark, e.g., amazon.com/Seattle.
Note:The short URL works across all marketplaces, but is only displayed on the Amazon.com domain.
Stores Eligibility Requirements
Brand Stores are available to sellers enrolled in Amazon Brand Registry, vendors, and agencies. You don’t need to run Amazon ads to create a Store, but you must meet the Stores eligibility requirements.
Content Requirements
In addition to having a valid account, your Store must comply with all Stores content guidelines to pass moderation and go live. Most reviews finish within 24 hours, but they may take up to three business days.
Customers often head to Amazon in search of items that fit their needs, while also hoping to discover new products and brands. Brand Stores, a free self-service tool, offer brands the chance not only to feature their merchandise but also to communicate their brand’s unique benefits, build a distinctive shopping journey, and potentially increase purchases as well as foster customer loyalty.
According to Amazon data, new-to-brand shoppers who visit a Brand Store are 62.7% more likely to make a purchase compared to those who don’t. Moreover, these shoppers spend 72.3% more on average when they buy after visiting a Brand Store versus those who don’t. In this guide, you’ll learn what Brand Stores are, how to create one for your brand, and how to maximize its advantages.
What Are Brand Stores?
Think of a Brand Store as your brand’s digital storefront on Amazon. It offers a multi-page, immersive shopping environment that increases the likelihood of customers getting to know — and growing to love — your brand. In turn, this familiarity can lead them to purchase your products.
A Brand Store allows you to:
Showcase your full product lineup.
Feature specific collections, seasonal offers, and discounts.
Present storytelling content about your brand’s background.
Best of all, creating a Brand Store is completely free.
How To Create Brand Store In Amazon
There is no cost to create a store, and no design background is required.
Below is an example of the Apple Brand store design. It excels in delivering a clean, minimalist aesthetic that aligns perfectly with Apple’s premium branding. The clear product categorization, high-quality images, and intuitive navigation create a seamless shopping experience that feels refined and sophisticated.
Apple Amazon Brand Store Example
Clean and Minimalist Design — The store features a sleek, modern aesthetic with ample white space, making it visually appealing and easy to navigate.
Clear Product Categorization — The layout effectively separates product categories (Mac laptops, iPads, Apple Watch, AirPods), making it easy for users to find what they’re looking for.
High-Quality Product Images — The store uses crisp, high-resolution images that showcase the products effectively, improving engagement and conversion rates.
Easy Navigation — The top navigation bar includes a clear structure with product categories, a search bar, and a “View All” button under each category, which aligns with Amazon’s best practices for user-friendly navigation.
Strong Branding — The store maintains Apple’s consistent branding with its iconic typography, imagery, and design language, enhancing trust and brand recognition.
While traditional e-commerce best practices often emphasize promotions, reviews, and aggressive CTAs, Apple’s approach prioritizes elegance, simplicity, and brand trust over clutter.
The absence of discounts or social proof may seem like a drawback in a typical online store, but for a brand like Apple, it reinforces exclusivity and confidence in its products.
Instead of overwhelming customers with urgency-driven tactics, the design encourages exploration and discovery through subtle yet effective navigation cues. This balance ensures the store remains both aesthetically appealing and functionally effective, reflecting Apple’s philosophy of merging technology with effortless user experiences.
Amazon Brand Store Templates
You can use pre-made templates and a drag-and-drop interface to develop a store that suits your brand identity and highlights your best-selling products.
One design best practices is the “above the fold” section of a Store — what it is, why it matters, and how to leverage it effectively. Traditionally, “above the fold” refers to the top section of a newspaper or newsletter, visible without unfolding the page. In a digital context, particularly for Amazon Stores, it represents the content immediately visible when a shopper lands on the page — before scrolling.
Source: Amazon
This prime real estate is crucial for capturing attention, establishing brand identity, and making a strong first impression. Since shoppers tend to focus on this area, optimizing it can significantly impact engagement and conversions.
Once you’ve built your Brand Store, the next step is attracting visitors. Customers can find your store by clicking on your brand byline on Amazon product detail pages or by visiting the short URL for your store. The “store byline” is the link near the top of a product detail page.
You can also use your store as a landing page for Amazon or non-Amazon marketing efforts, helping boost brand awareness and cross-selling opportunities.
Below are five strategies to help generate traffic and engagement:
Sponsored Brands
One of Amazon’s self-service advertising tools is Sponsored Brands. When configuring a Sponsored Brands campaign, you decide whether to direct customers to a custom landing page featuring a product collection or to your Brand Store. Data shows advertisers who linked their Sponsored Brands campaigns to a Store saw shoppers spend twice as long on their Store. Additionally, there was a 55% increase in product detail page views and a 15% increase in sales.
Byline
The byline appears near the product title in blue text on product detail pages. This link can drive organic traffic to your Brand Store. Shoppers curious about your brand can click on the byline and land directly on your Store.
Posts Posts on Amazon can also help drive visitors to your Brand Store. When customers see your post and feel inspired, they can click through to reach your Store directly. This creates a smooth transition from your content to exploring more about your brand, products, and story.
External Traffic
You can also encourage audiences on external platforms — such as social media, email marketing, or your own website — to visit your Brand Store by sharing a trackable link. In your Store’s insights dashboard, you can create a source tag for each link, then track the traffic and engagement from these external sources.
Search Engine Optimization (SEO)
You can leverage SEO in a few ways to drive traffic:
Google Sitemap: Brand Store pages’ URLs are included in Google’s Sitemap, which notifies search engines about your pages to crawl and index.
Canonical URLs: For Brand Stores that share the same name as the brand byline, a canonical URL is generated containing both the Store and page name. This helps search bots recognize the relationship between the Brand Store and relevant keywords.
Deep-linking on iOS: Brand Store links posted on third-party sites automatically open the Amazon Shopping app on iOS if it’s installed, leading shoppers directly to your Store page.
Stores Insights
The Stores insights feature provides data on your Store’s performance, including traffic metrics and sales figures broken down by both traffic source and Store page.
Once your Brand Store is live, you can monitor its progress using the insights dashboard. Here’s how to access it:
In the left navigation menu of your Amazon Ads console, click the Brand home icon.
Select Stores.
Locate your Store and click See Insights.
If you’re using the Store builder, switch to the Insights tab within the builder. You can view metrics for the entire Store or for specific pages currently being viewed.
The insights dashboard highlights daily visitors, page views, and sales attributed to your Store. You can export some of this data as a CSV file, but there are no dedicated Stores insights reports beyond what’s in the dashboard. Data appears as follows:
Page views and visits: Available the next day.
Attributed units and sales: Available after two days.
For example, on a Wednesday, you can see views and daily visits up to Tuesday and attributed units and sales up to Monday.
Navigating the Stores Insights Dashboard
A sidebar lets you switch between the different reports: Overview, Traffic, Engagement, Sales, Pages, and Sources. Each view displays your data in graph form.
You can adjust the date range to get insights over various windows of time and compare performance across different periods.
The Overview tab provides a big-picture summary of your Store’s performance. You can see multiple dimensions at once, then dive deeper into each individual metric through the other tabs.
Traffic
The Traffic section has four key dashboards:
Daily Visitors: Displays the number of visitors per day. Use this to assess whether your Store promotions or advertising tactics are attracting consistent traffic.
Page Views: Shows how many page views you receive each day, including repeat views by the same audience. You can gauge whether customers are browsing multiple pages and how often they’re returning.
Top Sources by Views: Shows where visitors are coming from, helping you identify which channels are most effective in driving Store traffic. This can inform adjustments to your marketing strategy.
Top Pages by Views: Lists the most frequently viewed pages in your Store. These insights help you learn which product categories or collections are generating the most interest.
Engagement
The Engagement tab focuses on how customers interact with ASINs within your Brand Store. Insights on ASIN clicks, click-through rates, and purchases can help you improve your Store layout and increase overall engagement.
Benefits of using the Engagement tab:
Identify high-performing and most-viewed ASINs to optimize the Store layout and increase click-through and purchase rates.
Gain visibility into products with the best engagement (view-based CTR) and sales (click-based CVR), guiding decisions on which ASINs to feature more prominently.
Spot consumer trends around pricing, inventory, and product planning.
Data available in this tab includes:
Product Engagement Totals: Summaries of ASIN views, clicks, and overall click-through rates.
Top-Clicked Product: Identifies the most-clicked ASIN and displays its views, clicks, CTR, purchases, conversion ratio, and average sale price.
Product Engagement: Detailed metrics for each ASIN, including renders, views, in-stock views, in-stock view rate, average in-stock price, clicks, CTR, add-to-cart, purchases, units sold, conversion ratio, and average sales price.
You can scroll horizontally to see all columns, or use the search box to filter for specific ASINs. For more details, visit the Stores metrics section.
Sales
The Sales tab has four primary dashboards:
Sales: Shows total sales over the chosen time frame, with a dotted line indicating the average daily sales. Use this to see whether your Store and marketing efforts are boosting revenue.
Units Sold: Reveals how many individual products you’ve sold (in units). A dotted line indicates your average daily unit sales for the period.
Top Sources by Sales: Breaks down how customers found your Store before making a purchase. This helps you pinpoint which traffic sources are most profitable.
Top Pages by Units: Shows which pages lead to the most units sold. By examining this data, you can see which pages are most effective at prompting deeper exploration of your products.
Stores Metrics
The Stores insights dashboard offers detailed information on traffic and sales so you can evaluate your Store’s performance.
Here are the key metrics included:
Add to cart: Number of times customers clicked the “Add to cart” button in your Store.
Avg. sales price: Average price of units sold on Amazon within 14 days of the shopper’s last visit to your Store. Includes products listed on your Store or elsewhere under your brand.
Clicks: Number of times a shopper clicked a product in your Store.
Click-through rate (CTR): Percentage of viewers who click a product, calculated as clicks divided by views.
Conversion ratio: Percentage of units sold (attributed to your Store) divided by clicks. Attributed sales are products purchased within 14 days of a visitor’s Store visit.
In stock views: Views where more than 50% of the product tile was visible for over 1 second while the product’s availability status was “in stock.”
In stock view avg. price: Average product price when the product was viewed in-stock.
In stock view rate: Percentage of product views in your Store that occur while the product is in stock.
Orders: Estimated total orders placed by Store visitors within 14 days of their visit. Each order can contain one or multiple units sold.
Purchases: Number of orders in which a specific product was purchased, attributed to your Store. One order can include multiple products.
Renders: Number of times the product fully loaded within your Store’s interface.
Sales: Estimated total sales generated by Store visitors within 14 days of their visit.
Sales/Order: Average sales per order.
Sales/Visit: Average sales per visit.
Sales/Visitor: Average sales per visitor.
Units sold:Number of individual units sold (across any products under your brand) within 14 days of their last Store visit.
Units/Order:Average units purchased per order.
Views:Number of times more than 50% of a product tile was viewed for more than 1 second.
Views/Visitor: Average page views per visitor.
Views/Visit: Average page views per visit.
Visitors: Total unique visitors to your Store during the selected period. A single visitor may view multiple pages or arrive through multiple sources.
Visits:Total visits to a page or from a traffic source on a single day. One visitor can make multiple visits, and can also arrive via different sources.
Dimensions
Date: Calendar date of the visit.
Page: Which Store page was viewed. Data for deleted pages is aggregated under “deleted page.”
Traffic source: The channel that led the visitor to your Store.
Traffic Source Types
Sponsored Brands: Traffic from Sponsored Brands ads.
Amazon organic traffic: Traffic from the brand byline link on product detail pages.
Your tags: Traffic that came from a custom source tag you created.
Other sources: All other traffic, for instance, URL shares on various social media platforms.
Watch For Out-of-Stock Products in Stores
When featured products in your Store go out of stock, these best practices can help maintain a positive customer experience:
If you have fewer than 16 ASINs in a product grid, avoid using “Hide out of stock”. Instead, keep products visible, so customers don’t encounter empty product grids.
If you have more than 16 ASINs and anticipate some going out of stock, you can use Hide out of stock to show only in-stock items.
If a large portion or an entire product grid is out of stock, consider updating your grid to highlight only the most vital ASINs. Alternatively, feature a top product using a full-width product tile without using “Hide out of stock.” You can re-expand the collection once the items return to stock.
If your page only displays a product grid, incorporate other elements (like video) to keep shoppers engaged when items are out of stock.
Short URL for Stores
Once your Store is published, a long URL is automatically created. You can replace it with a short URL for easier recall. Note that this short URL only links to the homepage of your Store.
Tip:Plan URL edits or deletions wellin advance of major sales or holiday eventsto avoid disruptions.
Best Practices for Creating a Short URL
DoDon’t Ensure the short URL includes your brand name or something closely related to your Amazon Ads account. For example, amazon.com/[brandname] Use generic category names, such as amazon.com/toys, or Amazon-owned trademarks (e.g., Fire, Kindle, Alexa, Echo). Characters like “-” or “_” can replace spaces if needed, for example: amazon.com/brand_name Start or end your short URL with “-” or “_” or use special characters like @, $, #, *, /. City names are allowed if they’re part of your brand name, e.g., amazon.com/BostonLager Use a city name that conflicts with an Amazon internal product or trademark, e.g., amazon.com/Seattle.
Note:The short URL works across all marketplaces, but is only displayed on the Amazon.com domain.
Stores Eligibility Requirements
Brand Stores are available to sellers enrolled in Amazon Brand Registry, vendors, and agencies. You don’t need to run Amazon ads to create a Store, but you must meet the Stores eligibility requirements.
Content Requirements
In addition to having a valid account, your Store must comply with all Stores content guidelines to pass moderation and go live. Most reviews finish within 24 hours, but they may take up to three business days.
Why the Search Terms Report is Essential for Sponsored Brands
Choosing the right keywords can be tricky. You want to reach shoppers most likely to buy, not waste your budget on terms that don’t convert. The Keyword Report shows you exactly which keywords are working and which aren’t, helping you:
Understand which search terms lead to sales and which don’t
Make smarter decisions about bidding and budget
Find new keyword ideas to grow your brand reach
By seeing actual data on impressions, clicks, and conversions, you’ll spend your money more wisely and gain an edge in the marketplace.
Key Metrics Featured in the Sponsored Brands Search TermsReport
The report includes a few essential metrics. Understanding them will help you spot trends and opportunities:
Impressions: How often does your ad show up?
Clicks & Click-Through Rate (CTR): Are people who see your ad clicking it?
Cost-Per-Click (CPC): How much you pay each time someone clicks.
Conversions & Conversion Rate: How many clicks lead to sales.
New-to-Brand Sales: How many first-time customers your brand is winning.
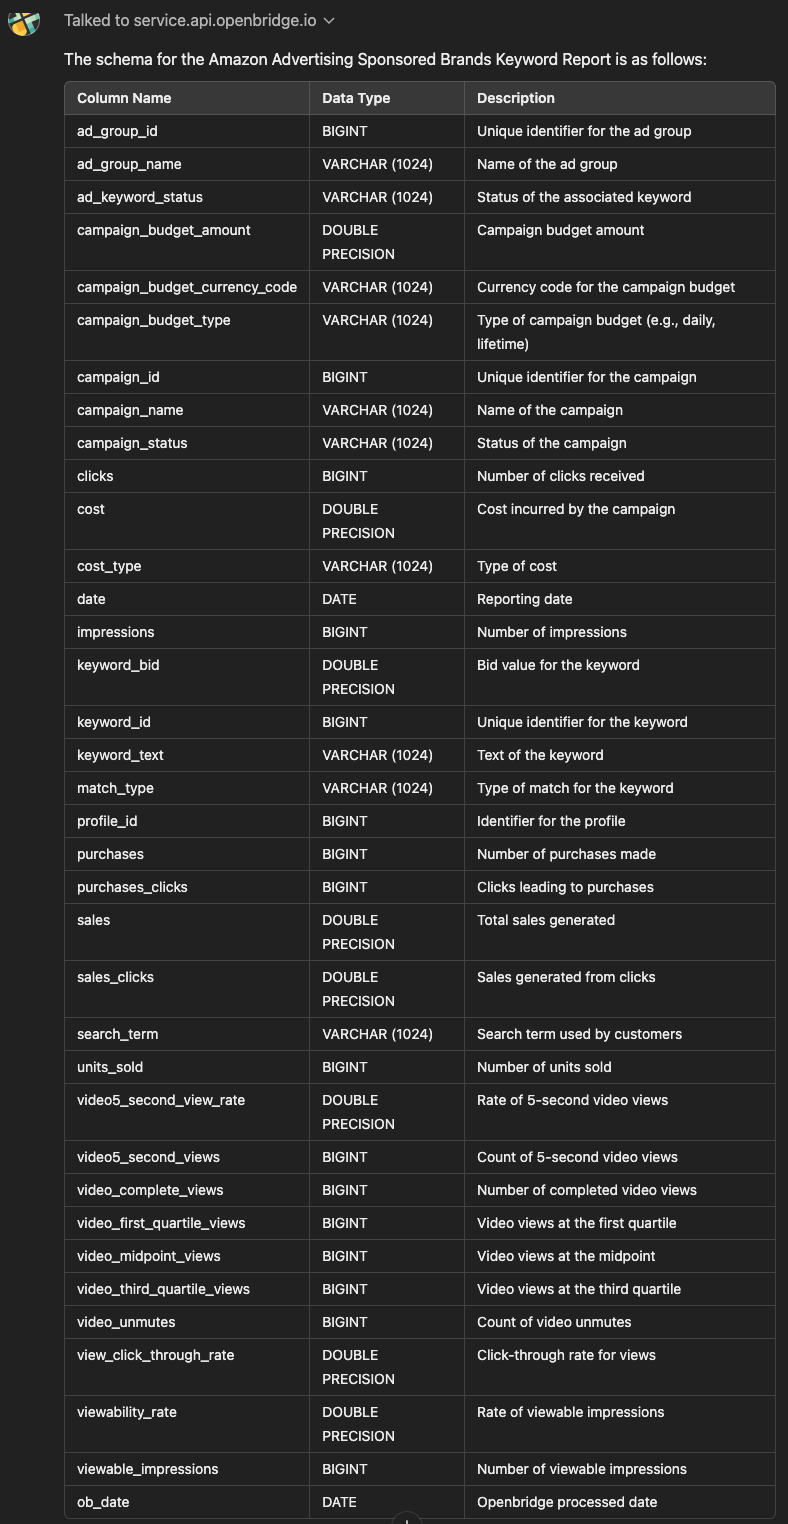
These are not the only metrics, using the Openbridge AI Data Copilot, you can see the complete Sponsored Brands Search Term Report schema:
With the various report metrics, you can see what’s working and what’s not. For example, a high CTR but a low conversion rate might mean shoppers are curious but unconvinced. A strong New-to-Brand number suggests you’re drawing fresh eyes to your brand.
Identifying High-Performing and Low-Performing Keywords
Once you have the report, it’s time to dig in. Looking for winners? Check for:
High CTR and conversions
Low CPC
Strong New-to-Brand sales
These are the keywords you may want to invest more in. Conversely, consider lowering bids or pausing keywords with low CTR, high costs, or weak sales. For example, if “organic dog treats” drive strong conversions while “healthy dog snacks” barely get clicks, focus on “organic dog treats (seeAmazon Ads Learning Console — Optimization Tips).
Leveraging Match Types for Better Targeting
Match types control how closely a shopper’s search must match your keyword. If the Keyword Report shows:
Exact match terms are converting well, you might raise bids on those terms.
Broad match terms are getting clicks but not sales; it might be time to refine them.
Phrase match terms doing well might be worth testing as exact matches to fine-tune targeting.
Using the report’s data, you can adjust which match types you emphasize. For instance, switching a high-performing broad match keyword to an exact match can focus your reach and reduce wasted ad spend.
Integrating Insights from the Search Term Report into Campaign Management
The Keyword Report isn’t just a bunch of numbers — it’s a roadmap. Use it to:
Adjust bids: Spend more on keywords that drive profits and spend less on ones that don’t.
Revise budgets: Shift more of the budget to performing the best campaigns.
Add or remove keywords: Add fresh keywords or remove those that don’t measure up.
Make it a habit to review your Keyword Report regularly. Checking it every month or quarter can help you stay on top of trends and respond to changes quickly. Pairing these insights with other Amazon ads reports — like the Search Term Report — gives you a complete picture of your campaign performance.
Expanding Keyword Lists with Search Term Insights
Your Search Term Report can also help you grow. You can add those as new keywords by reviewing the search terms that deliver strong results. On the flip side, you can also add low-performing search terms as negative keywords to block them, saving money. This constant refining helps you reach the right shoppers and improve your campaign health.
How to Be a Data-Driven Advertiser: Manual or Automation?
Here’s how to manually get your Search Term Report:
Log in: Access your Amazon Advertising console.
Find Reports: Click on the “Reports” tab in your dashboard.
Choose Sponsored Brands: Select “Sponsored Brands” and then pick “Keyword” as the type.
Select Timeframe: Pick “daily” or “summary” data.
Download: Hit “Run Report” and then download the file (usually in CSV format).
Looking to automate the flow of these reports?
Getting Started with Keyword Report Automation
Ditch the messy, manual reporting for Sponsored Brands Keyword Reports. Automated data feeds guide data-driven decision-making to improve off-Amazon digital marketing campaigns. Leverage attribution insights to refine strategies, allocate resources efficiently, and enhance customer engagement across all touchpoints.
Openbridge will unify and deliver performance data to data lakes or warehouses like Redshift, Google BigQuery, Snowflake, Azure Data Lake, and Amazon Athena, giving you a single source of truth. This unified data can turbocharge reporting and analytics tools like Google Data Studio, Tableau, Microsoft Power BI, Looker, Amazon QuickSight, SAP, Alteryx, dbt, Azure Data Factory, and Qlik Sense.
Why the Search Terms Report is Essential for Sponsored Brands
Choosing the right keywords can be tricky. You want to reach shoppers most likely to buy, not waste your budget on terms that don’t convert. The Keyword Report shows you exactly which keywords are working and which aren’t, helping you:
Understand which search terms lead to sales and which don’t
Make smarter decisions about bidding and budget
Find new keyword ideas to grow your brand reach
By seeing actual data on impressions, clicks, and conversions, you’ll spend your money more wisely and gain an edge in the marketplace.
Key Metrics Featured in the Sponsored Brands Search TermsReport
The report includes a few essential metrics. Understanding them will help you spot trends and opportunities:
Impressions: How often does your ad show up?
Clicks & Click-Through Rate (CTR): Are people who see your ad clicking it?
Cost-Per-Click (CPC): How much you pay each time someone clicks.
Conversions & Conversion Rate: How many clicks lead to sales.
New-to-Brand Sales: How many first-time customers your brand is winning.
These are not the only metrics, using the Openbridge AI Data Copilot, you can see the complete Sponsored Brands Search Term Report schema:
With the various report metrics, you can see what’s working and what’s not. For example, a high CTR but a low conversion rate might mean shoppers are curious but unconvinced. A strong New-to-Brand number suggests you’re drawing fresh eyes to your brand.
Identifying High-Performing and Low-Performing Keywords
Once you have the report, it’s time to dig in. Sort or filter the spreadsheet by your key metrics. Looking for winners? Check for:
High CTR and conversions
Low CPC
Strong New-to-Brand sales
These are the keywords you may want to invest more in. Conversely, consider lowering bids or pausing keywords with low CTR, high costs, or weak sales. For example, if “organic dog treats” drive strong conversions while “healthy dog snacks” barely get clicks, focus on “organic dog treats (seeAmazon Ads Learning Console — Optimization Tips).
Leveraging Match Types for Better Targeting
Match types control how closely a shopper’s search must match your keyword. If the Keyword Report shows:
Exact match terms are converting well, you might raise bids on those terms.
Broad match terms are getting clicks but not sales; it might be time to refine them.
Phrase match terms doing well might be worth testing as exact matches to fine-tune targeting.
Using the report’s data, you can adjust which match types you emphasize. For instance, switching a high-performing broad match keyword to an exact match can focus your reach and reduce wasted ad spend.
Integrating Insights from the Search Term Report into Campaign Management
The Keyword Report isn’t just a bunch of numbers — it’s a roadmap. Use it to:
Adjust bids: Spend more on keywords that drive profits and spend less on ones that don’t.
Revise budgets: Shift more of the budget to performing the best campaigns.
Add or remove keywords: Add fresh keywords or remove those that don’t measure up.
Make it a habit to review your Keyword Report regularly. Checking it every month or quarter can help you stay on top of trends and respond to changes quickly. Pairing these insights with other Amazon ads reports — like the Search Term Report — gives you a complete picture of your campaign performance.
Expanding Keyword Lists with Search Term Insights
Your Search Term Report can also help you grow. You can add those as new keywords by reviewing the search terms that deliver strong results. On the flip side, you can also add low-performing search terms as negative keywords to block them, saving money. This constant refining helps you reach the right shoppers and improve your campaign health.
How to Be a Data-Driven Advertiser: Manual or Automation?
Here’s how to manually get your Search Term Report:
Log in: Access your Amazon Advertising console.
Find Reports: Click on the “Reports” tab in your dashboard.
Choose Sponsored Brands: Select “Sponsored Brands” and then pick “Keyword” as the type.
Select Timeframe: Pick “daily” or “summary” data.
Download: Hit “Run Report” and then download the file (usually in CSV format).
Looking to automate the flow of these reports?
Getting Started with Keyword Report Automation
Ditch the messy, manual reporting for Sponsored Brands Keyword Reports. Automated data feeds guide data-driven decision-making to improve off-Amazon digital marketing campaigns. Leverage attribution insights to refine strategies, allocate resources efficiently, and enhance customer engagement across all touchpoints.
Openbridge will unify and deliver performance data to data lakes or warehouses like Redshift, Google BigQuery, Snowflake, Azure Data Lake, and Amazon Athena, giving you a single source of truth. This unified data can turbocharge reporting and analytics tools like Google Data Studio, Tableau, Microsoft Power BI, Looker, Amazon QuickSight, SAP, Alteryx, dbt, Azure Data Factory, and Qlik Sense.
If you’re selling products on Amazon and running ads, you’re probably familiar with the importance of tracking and optimizing your ad performance. But how can you know if your efforts are paying off? That’s where the Amazon Advertising Sponsored Product Campaign Report comes in.
Whether new to Amazon advertising or looking to sharpen your strategy, understanding these reports can make a huge difference in maximizing your ad spending and growing your business.
Understanding the Campaign Report for Sponsored Products
The Campaign Report for Sponsored Products is a comprehensive tool designed to show how well your ads perform over a specified period. You can use it to evaluate everything from daily performance to monthly trends, allowing you to make informed decisions on improving your campaigns.
This report summarizes the performance of your Sponsored Products ads across different campaigns. It tracks crucial metrics and helps you analyze the effectiveness of your ad strategies. You can use it to:
Track your ad spend
See how many impressions (views) your ads are getting
Measure how often people are clicking on your ads
Evaluate how much revenue your ads are generating
In short, the Campaign Report is your one-stop shop for tracking how well your ads are doing and what changes need to be made.
Types of Data Available in the Report
The Sponsored Product campaign report offers a variety of data types that can be helpful depending on how deep you want to dive into your ad performance. When you drill down into your report, you’ll see a variety of metrics that give a complete view of your campaign’s performance. Key metrics include:
Impressions: Understanding impressions can help you gauge the reach of your ads. If your impressions are low, it might indicate that your ads aren’t being shown to enough people.
Clicks: Clicks are a critical metric. A high click-through rate (CTR) generally means your ad appeals to customers. If clicks are low, your ad needs better call-to-action or more engaging visuals.
Spend: This metric shows how much money you’ve invested in the campaign. Tracking spend is essential for understanding whether you’re getting a good return on your investment.
Sales: Sales data is crucial in determining the effectiveness of your ads. If you get lots of clicks but low sales, your landing pages or product listings may need improvement.
ACoS and RoAS: These two metrics go hand-in-hand. A low ACoS means you’re spending less on ads than the sales generated, while a high ROAS shows that your advertising dollars are being used effectively.
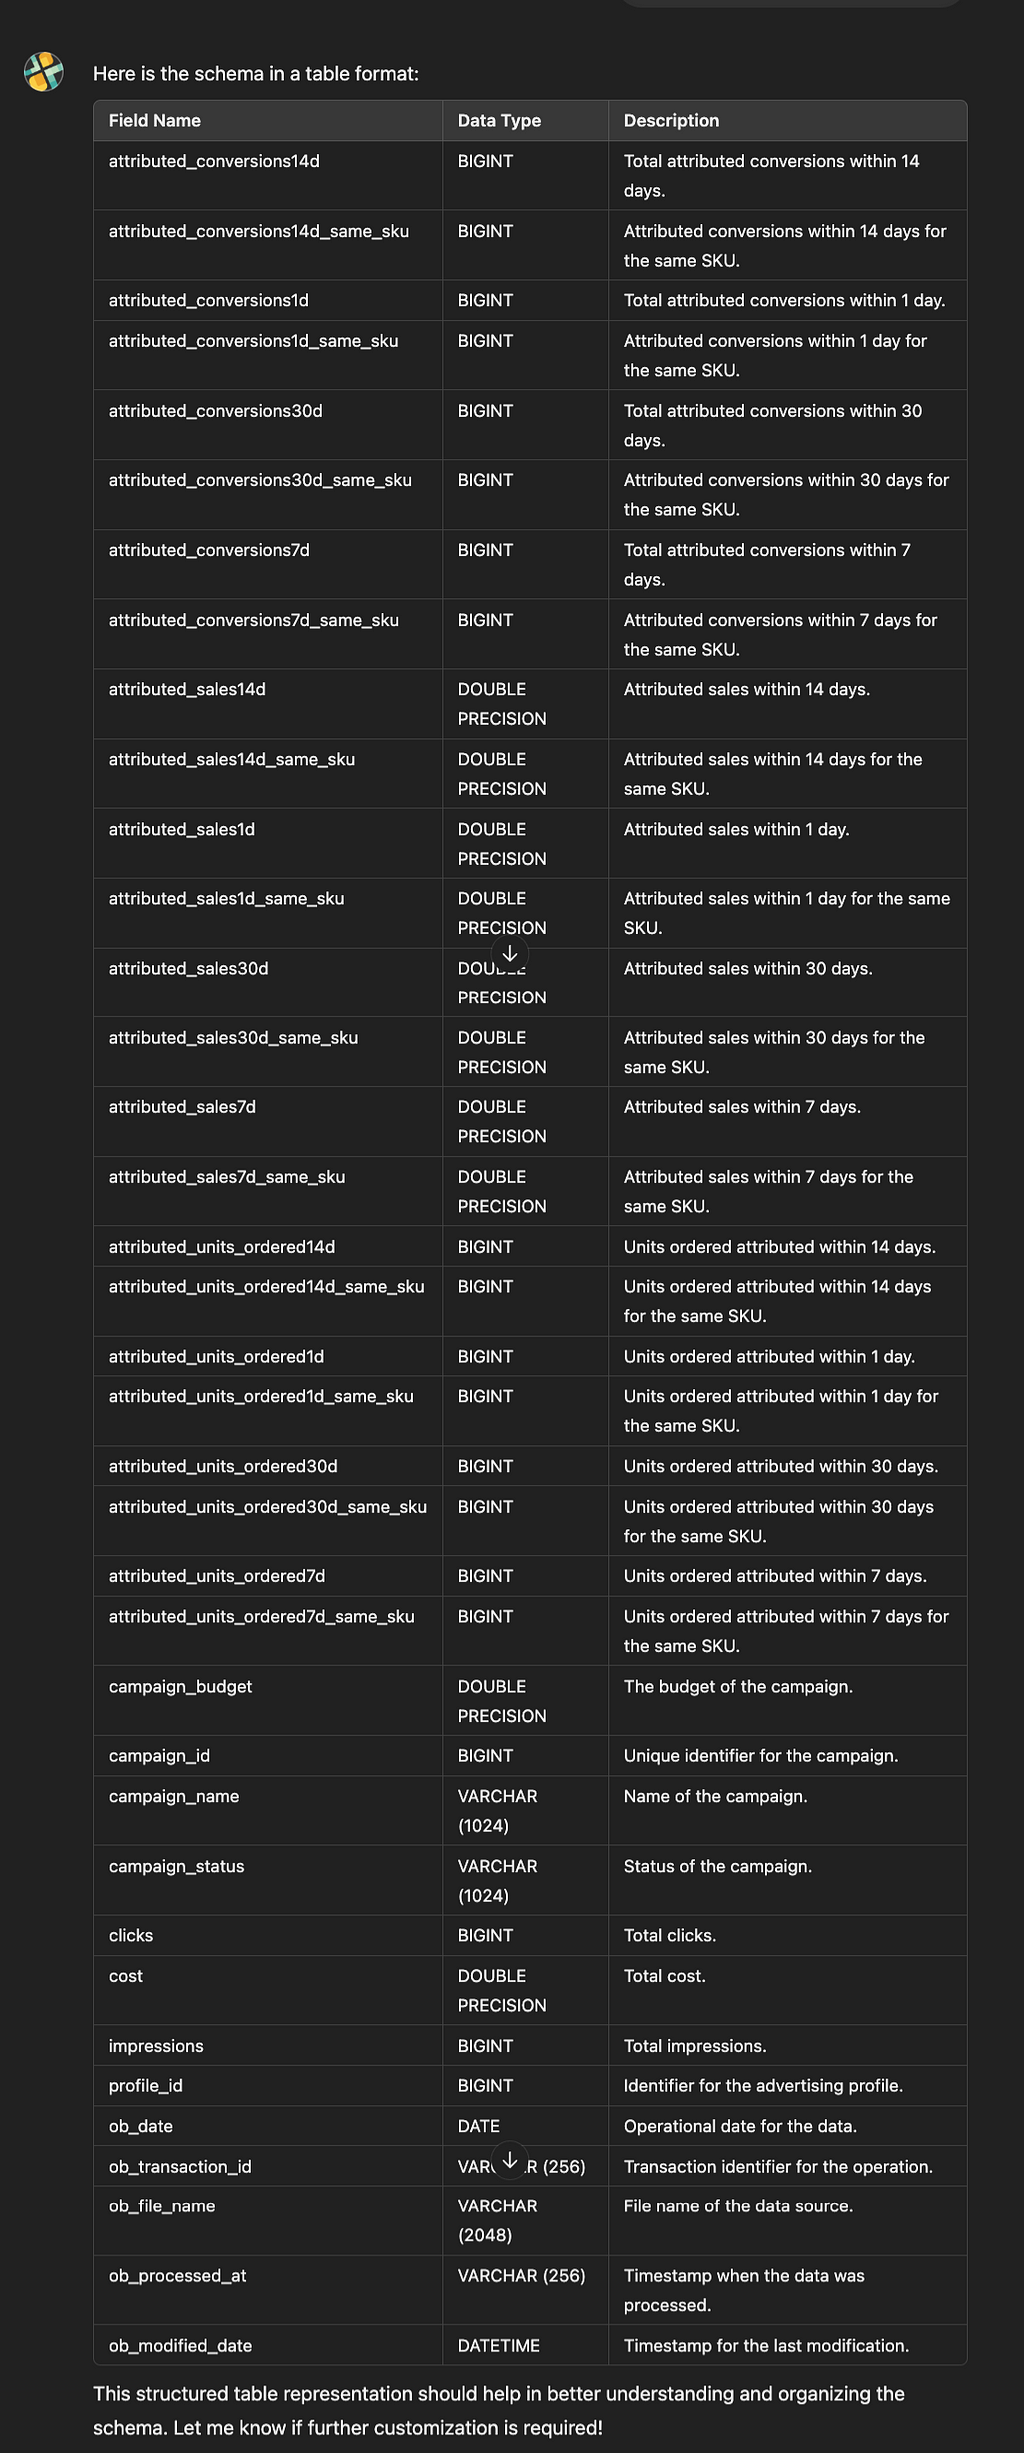
If you want a real-time AI-driven Amazon Advertising data copilot, the Openbridge AI Data Copilot can get you there fast:
How to Use Campaign Reports to Optimize Ad Performance
As you continue using these reports, remember that consistent analysis and optimization are the keys to success. Regularly review your campaigns, make necessary changes, and continue testing new strategies. The more you engage with your campaign data, the better your results will be.
Identify High-Performing Campaigns The first step is to identify which campaigns are doing well. Look for campaigns with high sales and a low ACoS. These campaigns are performing effectively, and consider increasing your budget for them or scaling your efforts.
Spotting Underperforming Campaigns If some campaigns have high ACoS or low sales, it might be time to re-evaluate. Here’s what you can do to improve underperforming campaigns:
Adjust your bids: If your ads aren’t getting enough impressions, you might need to increase your bid.
Change your targeting: Try targeting different keywords or your product targeting to reach a more relevant audience.
Update your ad copy: Sometimes, the wording or images in your ads might not resonate with customers. Test different versions to see what works best.
Adjusting Campaign Settings Once you’ve reviewed your data, it’s time to make adjustments. Consider:
Reallocating your budget: If a particular campaign performs well, consider increasing its budget while cutting back on less effective ones.
Modifying your targeting: Targeting the right audience is key. Use your report data to see which keywords or products generate the best results and focus more on those.
Optimizing your bidding strategy: If certain keywords are performing better than others, increase your bid for those keywords to ensure your ads get shown more often.
Getting Started with Amazon Ads Sponsored Products Data Automation
Ditch the messy, manual reporting for the Amazon Ads Sponsored Product Campaign Report. Automated data feeds guide data-driven decision-making to improve off-Amazon digital marketing campaigns. Leverage insights to refine strategies, allocate resources efficiently, and enhance customer engagement across all touchpoints.
Openbridge will unify and deliver performance data to leading data lakes or cloud warehouses like Redshift, Google BigQuery, Snowflake, Azure Data Lake, and Amazon Athena for an analytics-ready single source of truth to fuel informed decisions on brand building strategy, media, and customer demand for Amazon.
With your data unified, start to turbocharge reporting, analytics, and business intelligence tools like Google Data Studio, Tableau, Microsoft Power BI, Looker, Amazon QuickSight, SAP, Alteryx, dbt, Azure Data Factory, Qlik Sense, and many others.