Discover how to become a data-driven merchant with sales insights
The Sales reports from Amazon Vendor Central provide Vendors with detailed insights into account sales performance.
Amazon describes the reports as follows;
“Quickly identify opportunities by determining what is contributing to sales performance.”
What are the benefits of Amazon Vendor Central Sales Reports?
The sales reports offer Vendors key insights into account performance:
- Performance Analysis: Sales reports enable Vendors to analyze their sales performance over a specified period (in this case, yearly). This includes understanding which products (ASINs) are selling well and which aren’t.
- Opportunity Identification: By examining sales data, Vendors can quickly identify opportunities for improvement or expansion. This could involve increasing the stock of high-performing products or reassessing the marketing or pricing strategies of underperforming ones.
- Decision Making: The data aids in strategic decision-making, such as inventory management, marketing focus, pricing strategies, and forecasting future sales.
- Insight into Consumer Behavior: Understanding what drives sales and how customers respond to products.
- Financial Planning: Aids in more accurate financial planning and Revenue forecasting.
- Market Trends Analysis: Helps identify market trends and consumer preferences.
What Data Is Available For Vendor Central Sales?
As of 2023, Vendor Retail Analytics Sales reports and new “real-time” Rapid Retail Analytics sales feeds exist.
For information on the new real-time data for Vendors, see:
- Amazon Rapid Retail Analytics: New API for Real-time Metrics
- Unleashing Business Insights With Amazon Rapid Retail Analytics
This post will focus on Retail Analytics Sales reports.
What Is Included In Vendor Central Retail Analytics Sales Reports?
Here’s a breakdown of the Vendor Central Retail Analytics Sales Reports columns. There are two classes of Vendor Central Sales reports:
- Sourcing View: This report shows product sales data with an offer from a vendor code listed in the vendor group.
- Manufacturing View: This report provides ASIN-level data for products manufactured by the vendor.
The Sourcing report provides a detailed breakdown of product performance regarding revenue, cost, units shipped, and returns. The Sourcing report contains the following columns:
- ASIN: Amazon Standard Identification Number is a unique identifier for each product.
- Product Title: The name or title of the product.
- Brand: The brand associated with each product.
- Shipped Revenue: The total Revenue generated from the shipped products.
- Shipped COGS (Cost of Goods Sold): The cost of producing or purchasing the goods sold.
- Shipped Units: The number of units shipped.
- Customer Returns: The number of units customers return.
This Manufacturing report provides a comprehensive overview of the product’s performance. It differentiates between ordered and shipped metrics, giving a clearer picture of demand versus fulfillment. The Manufacturing report includes the following key columns:
- ASIN: Amazon Standard Identification Number, unique to each product.
- Product Title: The name or title of the product.
- Brand: The brand associated with each product.
- Ordered Revenue: The total Revenue from orders placed.
- Ordered Units: The number of units ordered.
- Shipped Revenue: The total Revenue generated from the shipped products.
- Shipped COGS (Cost of Goods Sold): The cost of producing or purchasing the goods sold.
- Shipped Units: The number of units shipped.
- Customer Returns: The number of units customers return.
Both reports have a few qualifications around what is and is not included in the data
- Exclusions: Warehouse Deals sales are not included in these metrics. This is important as it affects the accuracy and relevance of the sales data.
- Inclusions: Customer returns and free replacements are accounted for in shipped units and Revenue. This provides a more realistic picture of actual sales performance.
- Attribution of Returns and Cancellations: These are attributed based on the original date of the sale, affecting how Revenue and returns are analyzed over time.
Vendor Central API Automation For Data-Driven Sales Insights
The Amazon Selling Partner API (SP-API) allows for direct, automated access to Amazon Vendor Sales data, making it easier for businesses to integrate it into their systems.
The following are just a few examples of reports you can create with automated data using tools such as Google Data Studio, Tableau, Microsoft Power BI, Looker, or Amazon Quicksight.
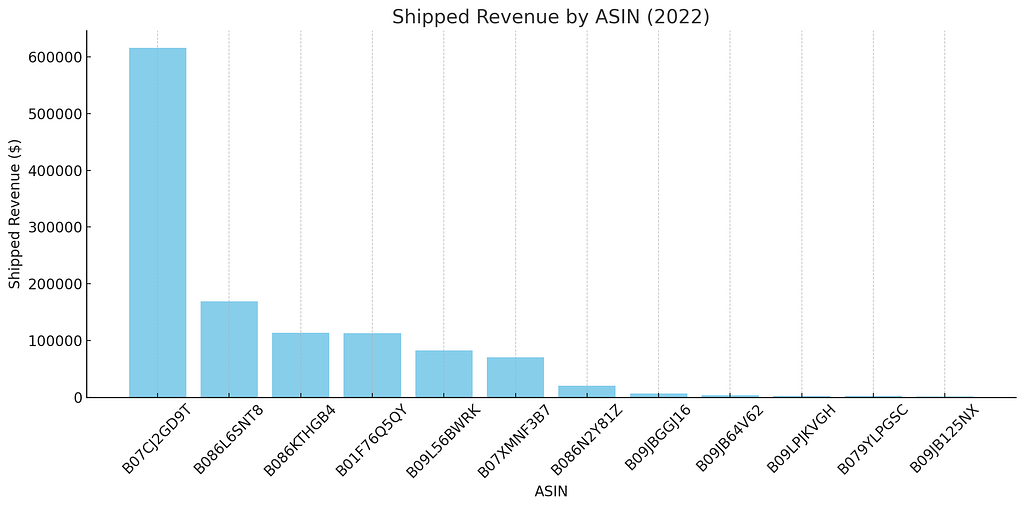
You can create simple, ASIN-based performance visualizations:

The bar chart above visualizes the ‘Shipped Revenue’ for different ASINs (products) in 2022, based on the Sourcing View report from Amazon Vendor Central. Each bar represents a specific product (ASIN), and the height of the bar indicates the total revenue generated from that product.
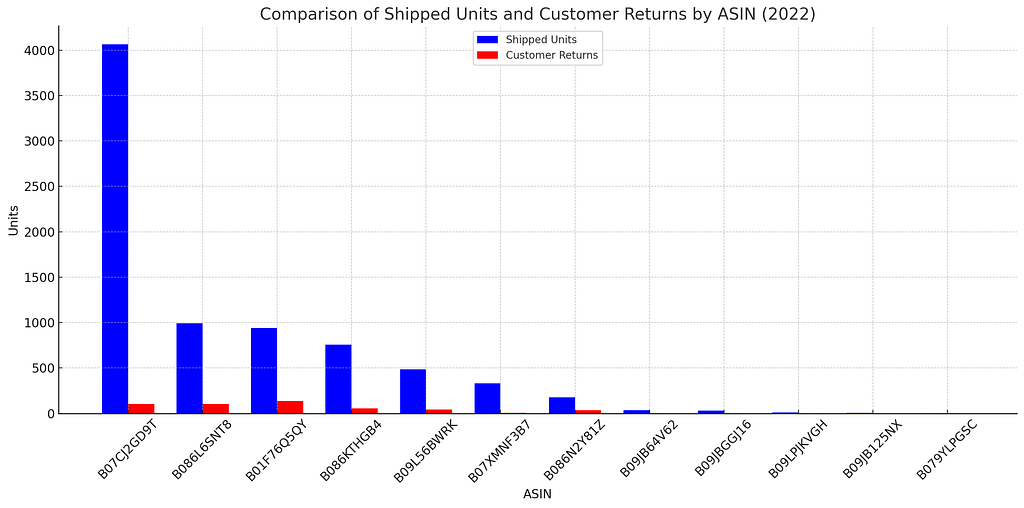
You can also create comparisons like shipped units and customer returns by ASIN:

The grouped bar chart above compares ‘Shipped Units’ (in blue) and ‘Customer Returns’ (in red) for each product (ASIN) based on the Sourcing View report for 2022. This visualization allows for an easy side-by-side comparison of these two metrics.
Product Portfolio Analysis
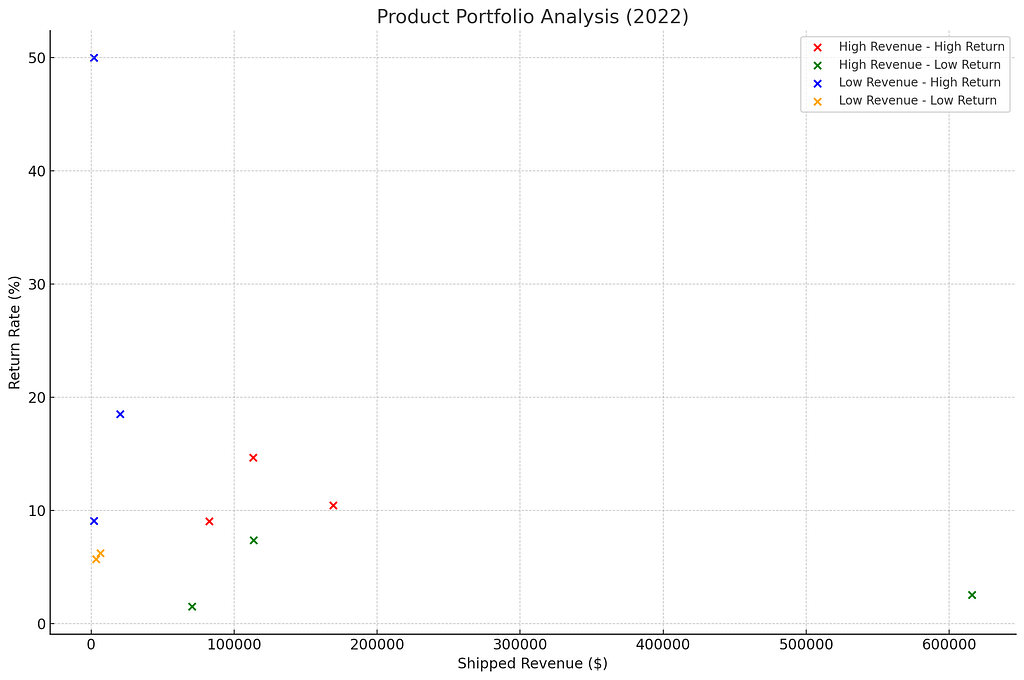
A Product Portfolio Analysis classifies products into categories based on revenue and return rates. The categories could be:
- High Revenue — High Return (Red): Products in this category generate high revenue but also have a high return rate. This might indicate issues with the product despite its popularity.
- High Revenue — Low Return (Green): These are the most desirable products, generating high revenue with a low return rate, indicating strong market fit and customer satisfaction.
- Low Revenue — High Return (Blue): Products that are not performing well in terms of sales and also experiencing high return rates. These might need reassessment or improvement.
- Low Revenue — Low Return (Orange): These products have low sales and low return rates, possibly indicating niche markets or opportunities for increased marketing or product development.
We use the ‘Shipped Revenue’ and ‘Customer Returns’ metrics for the analysis. We calculate each product's return rate (as a percentage of shipped units) and then use these two metrics to categorize the products.
The scatter plot below represents the Product Portfolio Analysis for 2022. It categorizes products into four segments based on their Shipped Revenue and Return Rate:

High Revenue — High Return:
- Products: B086L6SNT8, B01F76Q5QY, B09L56BWRK
High Revenue — Low Return:
- Products: B07CJ2GD9T, B086KTHGB4, B07XMNF3B7
Low Revenue — High Return:
- Products: B086N2Y81Z, B09LPJKVGH, B079YLPGSC
Low Revenue — Low Return:
- Products: B09JBGGJ16, B09JB64V62, B09JB125NX
How To Access Vendor Central Sales Reports?
Vendors have two primary paths to access Sales reports: manual downloads or API automation.
Manual downloading occurs in your Vendor Central account interface. Automation taps into the Amazon Selling Partner API (Amazon SP-API) to automate report processing and storage in a cloud warehouse or data lake (see the Amazon docs here).

Manual Access via Vendor Central:
- Login: First, Vendors must log into their Amazon Vendor Central account.
- Navigate to Reports: Usually found in the main navigation bar, this section contains various sales, inventory, and performance reports.
- Locate the ‘Sales’ Within the Reports section
- Select Date Range: Amazon allows Vendors to pull reports based on specific dates. Choose the desired range.
- Download: Once the report has been generated, there will typically be an option to download it. The report is often available in different formats .csv or .xls.
Note: Manual downloads are more time-consuming and may not be ideal for frequent and up-to-date data analytics.
Automate And Unify Your Vendor Central Sales Data — Free For 30 Days
Openbridge API automation allows Amazon Vendors to save time manually downloading Sales reports, increasing data velocity and reducing errors in messy merging and tracking downloaded reports.
Start your journey towards data-driven growth and profit with Openbridge. Our code-free, fully automated Selling Partner API integration simplifies your Amazon Vendor Central operations.
Ready to automate and unify your Amazon Sales Data?
→ Sign up for a 30-day free trial of our Vendor Central Sales Report automation.
Automated Amazon Vendor Central Sales Reports was originally published in Openbridge on Medium, where people are continuing the conversation by highlighting and responding to this story.
from Openbridge - Medium https://ift.tt/aLX4Yh5
via Openbridge